Laura Stowater
Maximizing water resources is crucial, especially in agriculture, with the increasing world population and limited freshwater.The purpose of this project was to determine how activated water affects plant growth in early plant life of tomatoes, radishes, peas, peppers, and green beans in view of plant height, chlorophyll levels, and time until emergence, compared to tap water. 28 replications of each of the five plant types were planted and watered, fourteen with the activated water and fourteen with Algona city tap water. The plants were in a controlled environment where they received equal light and water. The experiment studied the plants for the first twenty days because in that time the final yield potential is established. The number of plants emerged was totaled daily, the height was measured at days 10, 15, and 20, and the chlorophyll was measured at days 23 and 32. The collected data was then analyzed and independent, two-tailed t-tests were conducted to determine any statistical difference. The only statistical difference occurred in 3 out of 20 measurements for chlorophyll and height: day 20 in peppers, and days 10 and 15 in tomatoes, and this is when the tap water plants were significantly taller. From observations, the activated water plants seemed to have a greener color, healthier looking leaves, and a strong stem. The tap water fed green beans seemed to have lacked some of stability in the stem because three of the 14 broke and died, but one of the activated water fed pea’s stem was broken, but it continued to produce leaves and grow. More studies would be beneficial to further understand activated water’s effects on plants.
Activated Water:
Water is comprised of one oxygen and two hydrogens. Water is exactly the same as how it has been since the beginning of time, except the vibration is weaker, due to humans tampering with it: contaminating, polluting, changing, and purifying (Keuftedjian, 2017). When water is purified it is weaker; when it goes through piping its vibrational frequency is slower, it forms clusters and loses its crystalline structure. A study found that fish congregate in certain areas. Upstream and downstream from those populated areas there was less fish and they weren’t as healthy. It was found that the area of water with many healthy fish had a faster hydrogen frequency. The areas upstream and downstream had a slower frequency and the molecules of water formed large clusters. The purpose of activating water is to release some of the clusters to make the hydrogen and water molecules move faster. It does so when the water resonates over the ceramic based mineral ores; when this occurs, it is mimicking the river. As the positive hydrogen collides, it vibrates faster. Having clean water is not enough for maximum potential of water; vibration is key.
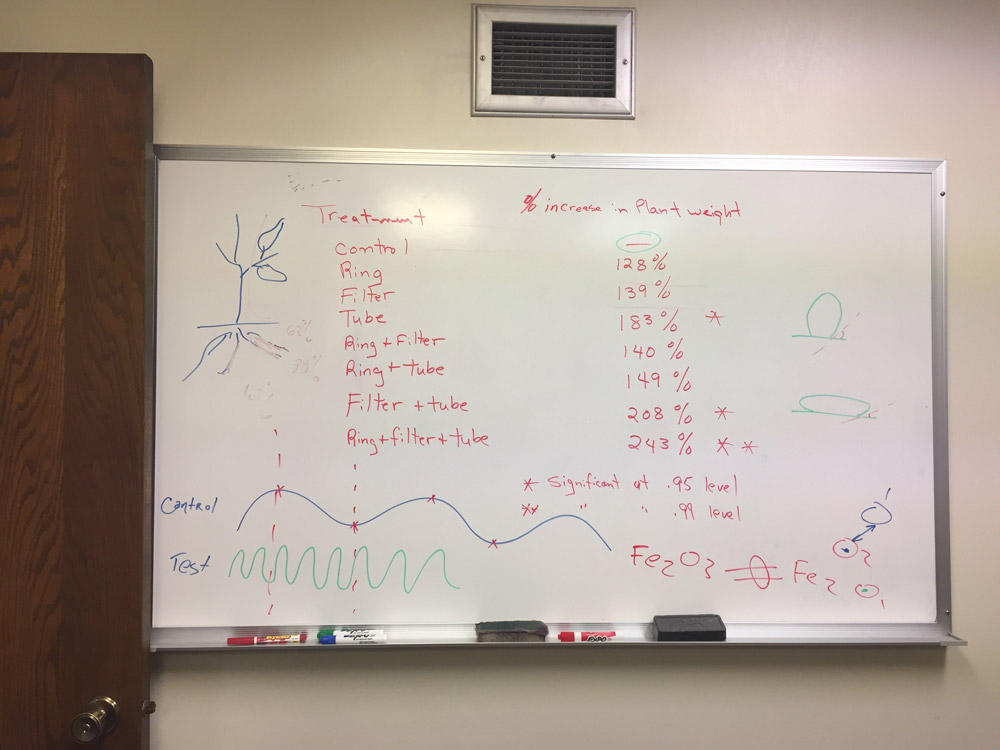
When water comes into contact with the specific ceramics it is also more soluble and absorbable. Activated water claims plants, through reduced surface tension and reduced size of molecular clusters, have increased hydration and penetration. Activated water will absorb through leaves and penetrate better to hydrate quicker. It will ease capillary action which is how water and nutrients move through the plant. Activated water causes 35% more water movement through the plant, determined by a previous study at Pursanova. With increased hydration, it strengthens the defense mechanism of a plant. Since bugs commonly attack weak plants, this will reduce the need for pesticides. The reduction in surface tension increases penetration. Normal water in a droplet forms a round balloon-like shape, but an activated water droplet is much flatter.
Activated water’s uses extend beyond agriculture. It has been used in pools, spas, commercial settings, livestock, restaurants, and in home. Different systems are designed and use different mineral ceramics based on their purposes and system set-up, however there some commonalities.
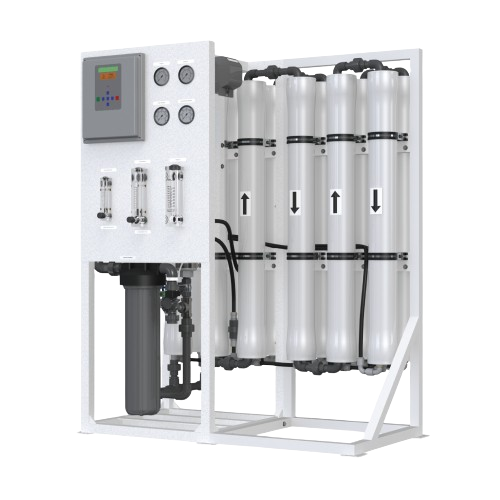
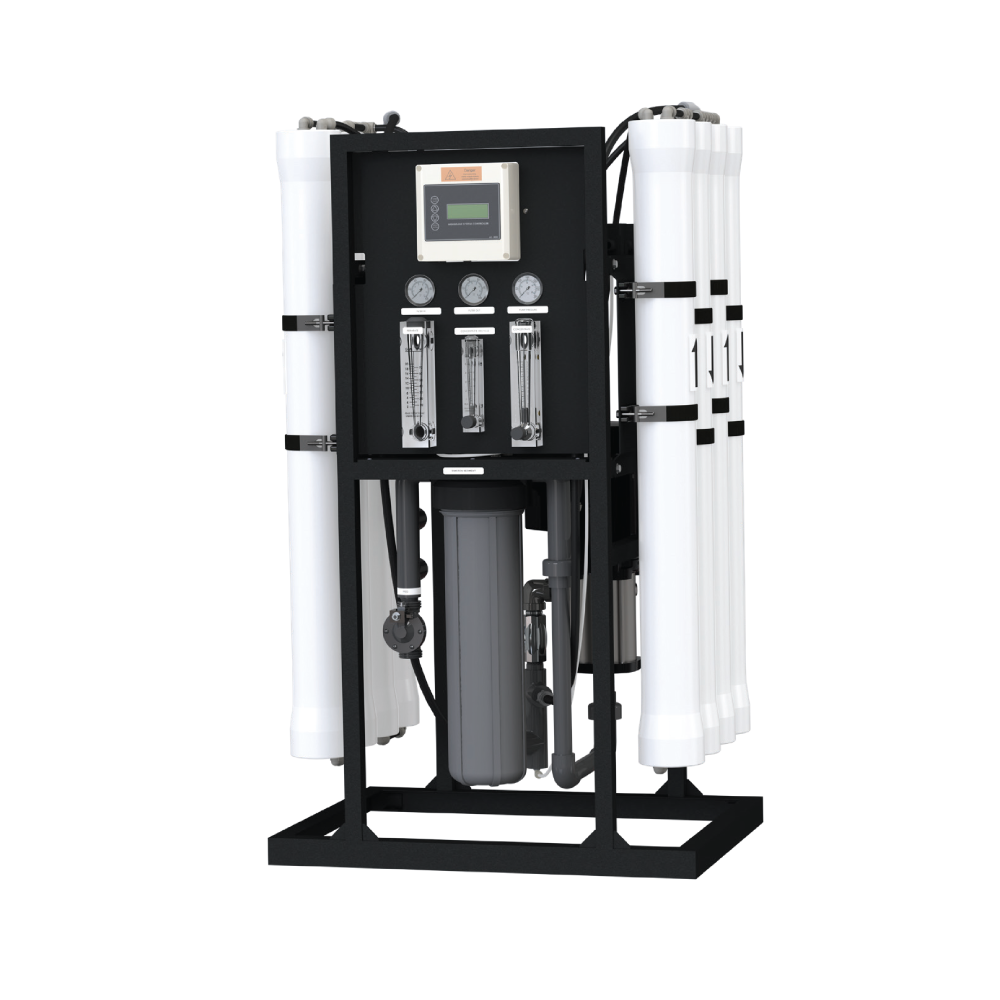
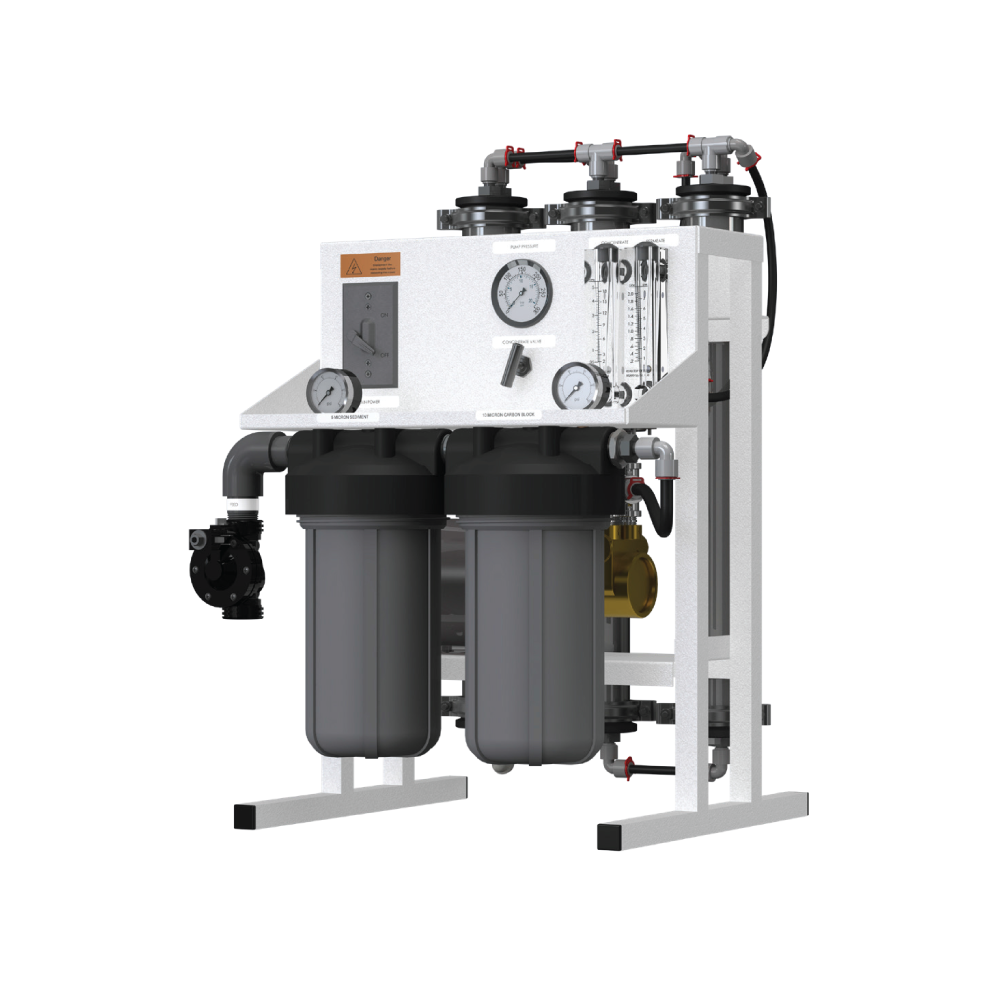
Pursanova systems are all made from sintered mineral ceramics, specifically aluminosilicates. Sintering is the process of firing powdered minerals at a high temperature- 13,000 degrees Celsius- to turn into a solid without going through a liquid state. Aluminosilicates are silicates where some of the silicon is replaced by aluminum; some include kaolinite and zeolite. Some of the systems purposes can reduce to eliminate chlorine and chloramine, reduce to eliminate heavy metals like iron, adsorb contaminants, deodorize, prevents rust and scale, cooling and heating for commercial use, maintain a high hydrogen activation frequency, and exchange ions-specifically cations. It also creates better tasting water. Pursanova uses resonance technology. These ceramic granules created anti-oxidizing effects. The treated water was also found to have a positive charge because of the formation of an electric double layer interface between the water and the mineral surface while no absorption or desorption occurs. Other research has shown the amount of chlorine ion absorbed by vegetable roots was greatly reduced when plants were watered with treated water as well as treated water inhibiting E. coli growth in poor nutritional culture. The system I used was the piece that activated the water in the Pursanova Reverse Osmosis (RO) system; it was designed for agricultural use. The systems can run in price from a few hundred dollars to more than ten thousand dollar. The portion of the Pursanova RO system that activates the water uses sintered kaolinite: Al2Si2O5(OH)4.
Activated water, also called the fourth phase of water or structured water, means that is arranged in a crystalline pattern at the molecular level. It is the organization of water molecules at the molecular level when water is close to a hydrophilic surface. This phase of water occurs in single layer sheets, hexagonally joined with of water molecules. A variety of method can be used to structure water, Water can exist in a variety of structures while still maintaining its same composition. Water always moves in vortices. When water moves through pipes, it produces water clusters, oligomers, which are water structures stuck together, in contrast with organized in crystalline shapes. It has been seen through Nuclear Magnetic Resonance (NMR) spectroscopy that water molecules can form clusters or hexagonal structure and its structure changes.
Activated water’s reduced surface tension and adjusted hydrogen bond angles can improve cell wall penetration, and allow for better hydration and bioavailability- bring in nutrients and water and remove waste. Water enters cells through aquaporin channels in plants and animals; these are channels through which a single water molecule can enter at a time, but several billion occur per second. Increased intracellular hydration in plants cells may lead to increased yield in crops.
Water: Chemistry and Properties
Water is comprised of one oxygen covalently bonded with two hydrogens through a shared pair of electron. Because oxygen also two unshared electrons, it causes water to be polar. The oxygen side of the water molecule has a partial negative charge because of the unshared electrons, while the hydrogen side has a partial positive charge. The electrostatic attraction between the opposite charge of the atoms creates a hydrogen bond. Since oxygen is an electronegative atom, a water molecules slightly negative oxygen can bond with a different water molecules slightly positive hydrogen atom, causing water molecules easily to bond with each other. Water staying together is called cohesion. Water also sticks to other things which is called adhesion. Polarity causes some ions and molecules to dissolve in water. The hydrogen bond causes many other unique physical properties of water like high specific heat, a high heat of vaporization, strong surface tension, and almost universal solvent abilities. The hydrophobic effect of non-polar compounds is also caused by the hydrogen bonds. Capillary action is caused by surface tension. The water will adhere to the organic tissues of the tubes that transport nutrients, but the surface tension will try to flatten it out. Movement will happen when the adhesion is stronger than the cohesion. The water will rise and cohere itself and the process continues again. The plants use capillary action and transpiration to bring water from the roots to distribute throughout the plant.
Early Growth:
Early growth in plants is critical to strong, healthy plants. The first 20 days establishes final yield potential. During this time, the metabolic pathway is established and this determines how many quality seeds and fruits will be produced later. High quality seeds and nutritionally dense fruits help feed the world. Water is an essential factor in this as it helps transport nutrients, helps create sugars, allow for chemical reactions, allow for it to stand up, and is a part of photosynthesis. Plants are 90% water, and agriculture uses about 2/3 of the earth’s fresh water, so conservation and efficient use of water is crucial.
Chlorophyll is one of the dependent variables measured in this project. Chlorophyll is the pigment found in chloroplasts of plant cells absorbing light energy. Light energy is then converted to chemical energy glucose (C6H12O6). More glucose in a plant, means more carbohydrates can be produced, resulting in a higher yield.
Compare the effects of activated water to tap water in plant growth.
How does activated water affect plant growth in early plant life of tomatoes, radishes, peas, peppers, and green beans in view of plant height, chlorophyll levels, and time until emergence?
If plants are watered with activated water, then these plants will have the desirable qualities of quicker emergence, increased chlorophyll level, and increased height because of the reduced surface tension, different hydrogen bond angles, and crystalline structure.
1. Fill all of the containers (140) with potting soil with perlite until one inch from the surface.
2. Compress the soil by dropping each tray with seeding-starting containers three times.
3. Place three rows of containers in the center of one tray to hold the radishes, tomatoes, and peppers of the activated water. Repeat for the tap water.
4. Place two rows of containers in the center of one tray to hold the peas and green beans for the activated water. Repeat for the tap water.
5. Again fill until one inch from the surface with potting soil and perlite mix.
6. Fill one five gallon bucket with water pumped from the hose- just tap water. Then attach the Pursanova Reverse Osmosis attachment to the hose and fill the other bucket.
7. Water each container 1/4 cup (2 oz.) by dipping a 1/4 cup measuring device in the bucket and pouring it in the container.
8. Sow the seeds according to directions on the packet at recommended depth.
9. Raise the tray to the height so that the top of the tray is 14 cm from the lights.
10. Count each day the number of plants emerged and record. Measure height after the first 10 days, then 15, and finally 20.
Plants are a responsive, changing living organism. Growers must adapt to changing needs of their plants. Therefore, the following procedures were made based on research in response to changes of the plants.
11. The following variables remained in place from Day 2-6: Lighting for 8 hours and 1 oz water given. Fresh activated water was drawn daily.
12. Day 7: The plants were very moist, so no water was given. All plant trays were lowered half their height.
13. Day 8-15: 1 oz of water was given. The amount of time the plants received light was increased to 12 hours from this point to the end of the experiment. Both types of water were drawn fresh from this point on until the end of the experiment.
14. Day 9: Photograph the plants.
15. Day 10: All trays were raised to 7 cm from the light.
16. Day 11: The trays of activated water (AW) and tap water (TW) green beans and peas were lowered while the rest remained at original height. The plants were measured this day for height.
17. Day 16: The plants were very moist, so no water was given. Plant heights were recorded again.
18. Day 17: Peas and beans were put on trays of their own kind and height was adjusted. 12 hour light. 1 oz. water.
19. Day 18: An oscillating fan ran for 5 hours to build stem strength until the end of the experiment. Everyday the plants were rotated to change how the plants bent.
20. Day 19-21: The water was run slower through the system to increase exposure to sintered kaolinite ceramics and their properties.
21. Day 19: Photograph the plants.
22. Day 23: Chlorophyll levels are measured.
Evaluation:
Data was recorded ten days following the first day plants were planted and then every five days after for plant height. Plant height was measured by placing the ruler at the top of the soil and measuring to the highest point on the plant in centimeters. Every day the number of plants emerged was counted. Emergence was considered any part of the plant breaking the surface of the soil and seen. Chlorophyll levels were measured with an atLeaf+ meter by placing the sensor over top most leaf, getting three reading, and recording the median reading. The atLeaf value was converted into milligrams per centimeter squared using http://www.atleaf.com/SPAD.aspx.
Documentation:
Data was recorded in a research journal. For statistical analysis, handwritten data was transferred to Google Sheets.
Statistics:
I performed an independent two-tailed t-test on all plant height and chlorophyll data using a t-test calculator from www.mathportal.org.
Data Analysis:
Benchmarks for emergence according to Texas A&M include:
● Bean: 5-10 days
● Pepper: 9-14 days
● Radish: 3-6 days
● Tomato: 6-12 days
● Pea: 6-10 days
All of the data can not be represented in the three tests of chlorophyll levels, plant height, and time until emergence. Quick and taller isn’t always necessarily better. I noticed that the leaves on the pea plants of the activated water were larger than those of the tap water counterparts. The leaves of the tap water peas were lighter in color and curled and shriveled at the ends. Also with both peas and green beans, the stems were much more rugged and durable looking on the activated water plants. The secondary leaves of the activated water tomato plants were much larger and set on earlier. Larger leaves is a positive trait because the leaf is where the chlorophyll receives the sunlight. The stems of the tap water plants seemed more spindly, thinner, weaker, and more prone to breaking than the activated water plants. In fact, 3 of the 14 TW green bean plants broke and died, and no AW green bean plants broke or died. One of the AW pea plants broke during watering, however it continued to produce leaves and grow like all of the other AW pea plants; there is no distinguishable difference between it and the others. This may suggest that the increased intracellular hydration had reparative effects. Also, I could not come to the lab and water the plants two days due to a blizzard. When I came back the radish leaves on the TW plants were yThe activated plants generally seemed to have better color and an overall robust, healthy look.
The major complication of this study is that Pursanova RO system was not compatible with the system setup for the project. I only had the piece of the system that activates. However, the setup doesn’t exactly replicate how the piece would work in an actual RO system. Pursanova systems and other water activating systems can cost more than $10,000. I spoke with the CEO of Pursanova about my project and the situation of its setup, and he suggested I used a different Pursanova system. The unexpected lack of compatibility may have lead to unforeseen results. I plan to further research activated water and its effects on plant growth with the new systems next year.
Radishes:
Radishes fed with tap water (TW) had a higher average height than the activated water (AW) at each of the three testing days. Independent two-sample t-tests between tap water fed plants and activated water fed plants were performed to determine whether there was a significant difference between the plant height at day 10, 15, and 20 of radish growth. However, the t-statistic was not significant at the .05 critical alpha level at any of the times, t(26)=1.6958, p= 0.1018691688 (day 10); t(26)=1.6291, p=0.1153535345 (day 15); t(26)=1.3693, p= 0.1826228249 (day 20). Therefore, I fail to reject the null hypothesis and conclude that the difference was not significant.The activated water was consistently -at each measurement dayless variant. The AW water had at least three times less variance each time, suggesting a more uniform and consistent plant height. Since the square root of variance is the standard deviation, there was also a lower standard deviation among the AW radishes, meaning there was a tighter cluster of where the majority of plants were, in terms of height. Taller plants are not necessarily a good or bad thing. However, taller plants require and use more energy and resources to grow.
According to research done by Texas A&M University, radishes should emerge from soil between days 3 and 6. By day 6, 13 of the 14 AW radishes had emerged and 11 of the 14 TW radishes.
The chlorophyll levels of radishes were measured at 23 days. An independent two-sample t-test between tap water fed plants and activated water fed plants was also performed to determine whether there was a significant difference between the plants’ chlorophyll. The t-statistic was not significant at the .05 critical alpha level, t(26)=1.6958, p= 0.1018691688. Therefore, I fail to reject the null hypothesis and conclude that the difference was not significant.
Green Bean:
Similar to the radishes, the tap water fed green beans were on average taller than the activated water fed green beans. Independent two-sample t-tests between tap water fed plants and activated water fed plants were performed to determine whether there was a significant difference between the plant height at day 10, 15, and 20 of radish growth. However, the t-statistic was not significant at the .05 critical alpha level at any of the times, t(26)=0.3111, p= 0.758176488 (day 10); t(26)= 0.3483, p=0.7304504413 (day 15); t(26)=0.1585, p= 0.8752990297 (day 20). Therefore, I fail to reject the null hypothesis and conclude that the difference was not significant. There was less variance of AW at day 10, but greater variance at days 15 and 20.
Green beans should emerge between days 5 and 10. 11 of the 14 activated water green beans had emerged, while 9 of the 14 tap water green beans had emerged at day 10.
Chlorophyll levels were measured at days 23 and 32. The mean of the AW beans was higher both times. However, the t-statistic was not significant at the .05 critical alpha level, t(26)=0.1456, p= 0.8832903478 (23 days); t(26)=-0.98706, p= 0.332712 (32 days). Therefore, I fail to reject the null hypothesis for both and conclude that the difference was not significant.
Peas:
Again, the average height of the tap water fed peas was greater than activated water fed peas. Independent two-sample t-tests between tap water fed plants and activated water fed plants were performed to determine whether there was a significant difference between the plant height at day 10, 15, and 20 of radish growth. However, the t-statistic was not significant at the .05 critical alpha level at any of the times, t(26)=1.3718, p= 0.1818534252(day 10); t(26)=0.726, p=0.4743055029 (day 15); t(26)=0.072, p= 0.9431267882 (day 20). Therefore, I fail to reject the null hypothesis and conclude that the difference was not significant. There was greater variance and standard deviation for the activated water compared to the tap water, similar to day 15 and 20 of green beans, but unlike day 10 of green beans and all of the radishes.
Peas should emerge between days 6 and 10. 14 of the 14 activated and tap water peas had emerged by day 10 for both.
Chlorophyll levels were measured at days 23 and 32. The mean of the AW peas was higher both times. However, the t-statistic was not significant at the .05 critical alpha level, t(26)=0.3008, p= 0.8120913247 (23 days); t(26)=-0.95493, p= .348408 (32 days). Therefore, I fail to reject the null hypothesis for both and conclude that the difference was not significant.
Peppers: The AW peppers were, on average, taller than the TW peppers at day 15, but on day 20 the TW peppers were, on average, taller. Independent two-sample t-tests between tap water fed plants and activated water fed plants were performed to determine whether there was a significant difference between the plant height at day 15 and 20 of pea growth. The t-statistic was not significant at the .05 critical alpha level on day 15, t(26)=-0.4214, p= 0.6764956278. Therefore, I fail to reject the null hypothesis and conclude that the difference was not significant on day 15. However, the t-statistic was significant at the 0.5 critical alpha level on day 20, t(26)=3.4521, p=0.001915764877. I reject the null hypothesis and conclude that the difference was significant on day 20. In this instance, the tap water made the plants significantly taller at day 20. This may suggest that the effects of activated water are expressed more at later stages of plant life, however more research should be conducted. There was less variance of AW at day 20, but greater variance at day 15.
Peppers should emerge between days 9 and 14. 3 of the 14 activated and tap water peppers had emerged by day 14 for both. By day 18, 12 of the 14 activated water peppers had emerged and 11 of the 14 tap water peppers had emerged, possibly suggesting later onset of that particular variety of peppers.
Chlorophyll levels could not be tested because the leaves were too small.
Tomatoes:
The tap water fed tomatoes were on average taller than the activated water fed tomatoes at each of the three times of measurement. Independent two-sample t-tests between tap water fed plants and activated water fed plants were performed to determine whether there was a significant difference between the plant height at day 10, 15, and 20 of tomato growth. The t-statistic was significant at the .05 critical alpha level at days 10 and 15, t(26)=2.182, p= 0.0383435147 (day 10); t(26)=2.4674, p=0.02051336443 (day 15). I reject my null hypothesis for days 10 and 15, and conclude there was a significant difference. However, at day 20, the t-statistic was not significant at the 0.5 critical alpha level, t(26)=1.84, p=0.07721948031. Therefore, I fail to reject the null hypothesis and conclude that the difference was not significant at day 20. There was greater variance of activated water fed tomatoes each time measured.
Tomatoes should emerge between days 6 and 12. By day 12, 11 of the 14 activated water tomatoes emerged and 14 of the 14 tap water tomatoes emerged.
Chlorophyll levels could not be tested because the leaves were too small.
The only statistical difference occurred at day 20 of the pepper growth and day 10 and 15 of the tomato growth, and this occurred when the tap water was significantly better. However, this is only three out of the twenty measurements for chlorophyll and height. Also, the non preferred compatibility between the Pursanova technology and its connection to getting water should not be disregarded. Further research would be beneficial to see how a different system of creating activated water would affect plants. Different plants’ reactions varied, and further research may be beneficial as the entire life of plant was not measured. It is possible that the effects of the activated water would be more drastic in later stages. As for its qualitative effects, the proof is in the pictures. The plants fed activated water had an overall robust look. The plants fed with tap water had stringy and weak stem and leaves had poor color; some of the TW green beans even broke and died. However an AW pea plant had been damaged at the stem, but continued to produce more shoots and leaves. More activated water fed radishes and green beans emerged by the time they were supposed to than tap water fed plants. Equal amounts of peas and peppers had emerged by their emergence period. Lastly more TW tomatoes emerged by their emergence time than activated water. More research and studies need to be done to fully understand structured water’s capabilities regarding plants.
With the increasing world population and limited freshwater, alternative methods of irrigation must explored in order to feed the world. Conservation of water is crucial, especially in agriculture, which uses about two-thirds of fresh water. Solutions like activated water maximize water resources in a world that needs sustainable and practical practices.
Risk and Safety:
There are minimal safety risks. When dealing with water and electrical plugs, they are kept apart and stored safely.
References
Department of Biochemistry and Molecular Biophysics. “Chemistry Tutorial.” Chemistry Tutorial.
University of Arizona, 28 Jan. 2003. Web. 18 Feb. 2017.
Johnson, Judith E., Ph.D., and Laurie A. Nickisch. “Pursanova Hydroponic Trials Using
Strawberry,Corn, Soybean and Wheat.” (2011): 1-54. Pursanova. Pursanova, 24 June 2011.
Web. 18 Feb. 2017. <https://pursanova.com/>.
Keuftedjian, Vatché. “Pursanova Activated Water.” Telephone interview. 30 Dec. 2016.
Keuftedjian, Vatché. “Pursanova.” Pursanova. Pursanova, 2013. Web. 18 Feb. 2017.
McNeill, Michael, PhD. “Early Plant Growth.” Personal interview. 30 Dec. 2016.
Smith, Edward G., and Joseph Masabni. “Texas Home Vegetable Gardening Guide.” Garden Site
(n.d.): n. pag. Aggie Horticulture. Texas A & M System, Feb. 2009. Web. 18 Feb. 2017.
<http://aggie-horticulture.tamu.edu>.
Ptok, Fabian, “Alternative Irrigation Methods: Structured Water in the context of a Growing Global Food Crisis due to Water Shortages” (2014). Undergraduate Honors Theses. Paper 182.
Pure Unstructured Structured Water – Because Some People Will Buy Anything. (n.d.).
Retrieved March 13, 2017, from http://www.acsh.org/news/2016/05/04/pure-unstructured-structured-water-because-some-p eople-will-buy-anythingReferences
Calculators :: Statistics Calculators :: T-Test Calculator. (n.d.). Retrieved March 12, 2017, from http://www.mathportal.org/calculators/statistics-calculator/t-test-calculator.php
Hypothesis Test Graph Generator. (n.d.). Retrieved March 12, 2017, from http://www.imathas.com/stattools/norm.html
Holmes, Matt. “Statistical Analysis and T-test.” Personal interview. 3 Jan. 2017. Photos taken by Laura Stowater and Dr. Michael McNeill